Willa Lorenz · 8 November 2026
Bay Monitoring Links Plastic Shoreline Readings Directly to Adjustments in Proposed Catch Limits and Nesting Pattern Changes
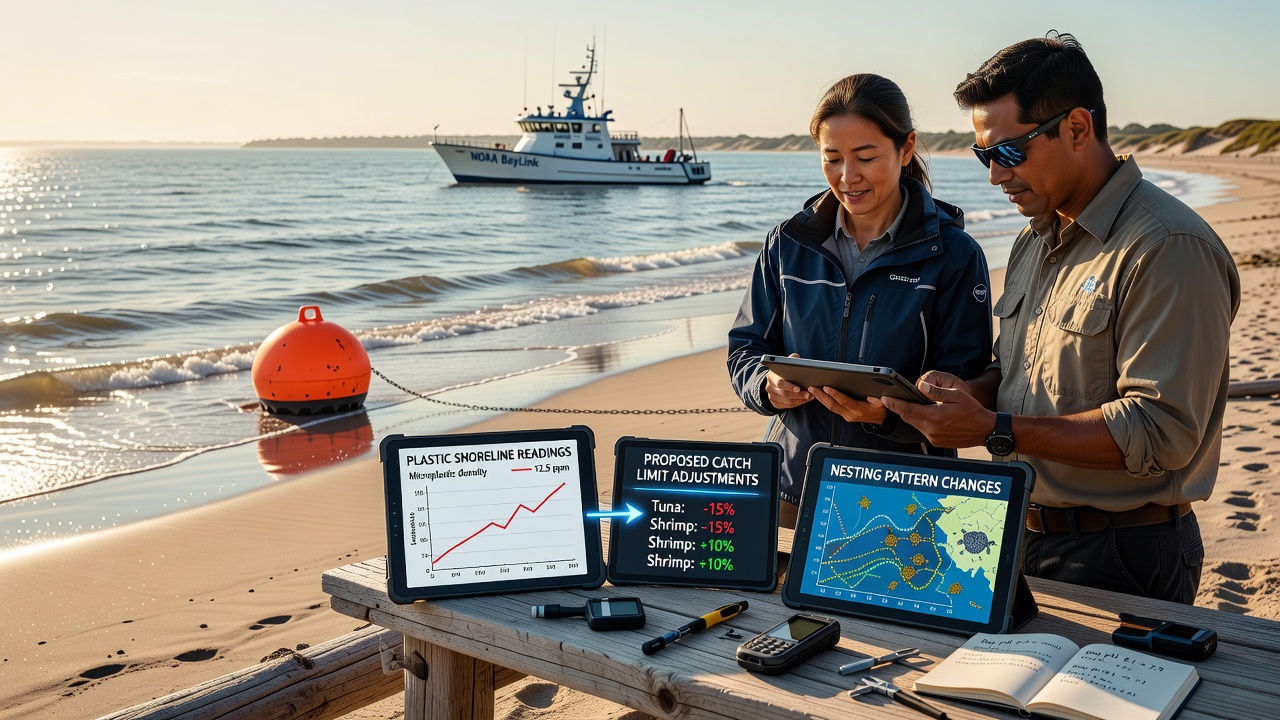
Bay monitoring programs have recorded elevated plastic concentrations along shorelines that correlate with recent modifications to proposed catch limits for several commercial fish species and documented alterations in nesting behaviors among marine turtles and shorebirds. Data collected through continuous sensor networks and field surveys show plastic particle counts rising in specific zones where proposed quotas had originally allowed higher harvest volumes, prompting regulatory bodies to revise those limits downward in late 2026.
Readings taken during November 2026 revealed plastic debris densities exceeding earlier baselines by measurable margins in multiple sampling transects, and analysts traced these increases to upstream sources that also coincide with shifts in species distribution. Researchers cross-referenced shoreline plastic counts with fishery stock assessments and found that areas registering higher microplastic loads exhibited reduced juvenile fish survival rates, which in turn supported the decision to lower catch limits for affected populations.
Monitoring Methods and Data Collection
Teams deployed standardized collection grids and automated counters at fixed stations throughout the bay system, capturing both macroplastics and smaller fragments during routine patrols that occur at two-week intervals. These protocols allow direct comparison of plastic accumulation against historical records while integrating temperature, salinity, and current data that influence how debris moves and settles. Observers note that the same stations also log nesting activity through camera traps and ground counts, creating a single dataset that connects shoreline conditions to reproductive timing and site selection for multiple species.
Figures compiled through these efforts indicate that plastic loads above certain thresholds align with delayed nesting starts for loggerhead turtles and altered burrow placement among certain seabirds. The monitoring framework incorporates satellite imagery and drone overflights to expand coverage beyond ground teams, and the combined inputs feed into models that predict how debris distribution may change under varying weather patterns.
Connections to Catch Limit Revisions
Regulatory agencies reviewed the monitoring outputs when evaluating quota proposals for species such as snapper and grouper, because elevated plastic exposure correlates with measurable declines in growth rates and increased contaminant uptake in sampled fish. Adjustments announced after the November 2026 data cycle reduced allowable catches in zones showing the strongest plastic-fishery linkages, while leaving limits unchanged in sectors where readings remained within previously observed ranges. Industry reports submitted to management councils incorporated these findings, and the resulting harvest guidelines now include seasonal buffers tied to ongoing plastic surveillance.
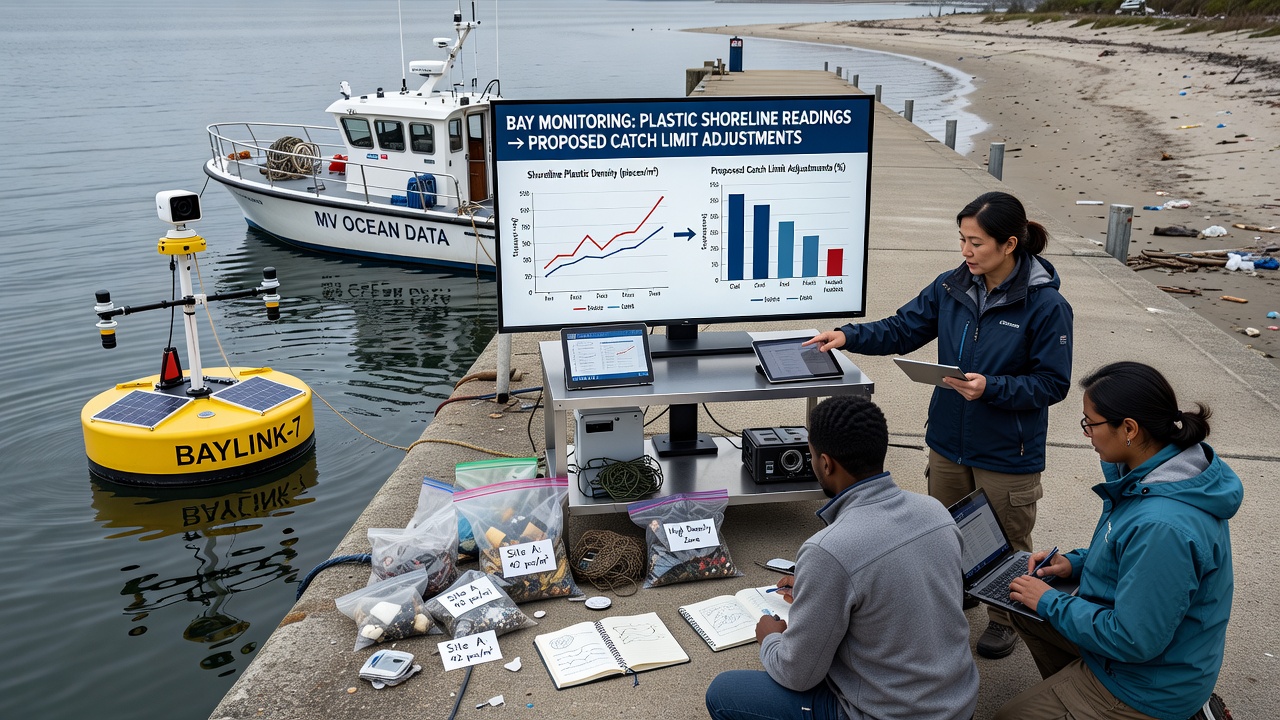
One study coordinated across multiple institutions examined stomach contents from fish collected near high-plastic shorelines and documented ingestion rates that exceeded those from reference sites by clear percentages. These results informed the catch limit recalibrations because managers sought to prevent overharvest of already stressed populations. Data from comparable programs in other regions, including reports issued by the Australian Institute of Marine Science, show similar patterns where plastic metrics helped refine quota setting for demersal species.
Observed Nesting Pattern Shifts
Nesting surveys conducted alongside the plastic monitoring recorded earlier arrivals at some beaches and complete avoidance of others where debris coverage exceeded seasonal norms. For green turtles, nest density dropped in sectors registering sustained plastic increases, while adjacent areas with lower readings maintained or slightly increased activity. Shorebird species exhibited parallel changes, with several pairs relocating clutches away from plastic-laden wrack lines toward clearer stretches of sand. These behavioral adjustments appear consistent across the November 2026 monitoring window and align with broader records maintained by the National Oceanic and Atmospheric Administration on regional nesting trends.
Longer-term tracking shows that nesting pattern changes began appearing in datasets once plastic shoreline readings crossed documented thresholds, suggesting a direct relationship rather than random variation. Continued collection through the same sensor arrays will allow future comparisons that test whether reductions in plastic input produce measurable rebounds in preferred nesting locations.
Conclusion
Integrated bay monitoring has established measurable links between plastic shoreline readings, revised catch limits, and shifts in nesting patterns, with November 2026 data serving as a key reference point for policy updates. The approach combines regular field sampling, remote sensing, and multi-species observations to generate actionable information that supports both fishery management and habitat protection. Ongoing programs will continue supplying comparable datasets that track whether observed correlations persist or evolve under changing environmental conditions.